Putting Evolution To the Test
The Missouri House Education Committee voted this session to approve HB 1266, the “Missouri Science Education Act.” This bill proports to improve science teaching in Missouri by helping students develop critical thinking skills. Teachers would have to clearly identify what is “verified emperical data” and distinguish it from what is “theory, hypothesis, conjecture, speculation” and the like. Similar bills are being considered in other states.
What are we to make of this? Opponents of these bills say their real goal is to undercut the teaching of evolution in classrooms by requiring teachers to describe evolution as “just a theory,” not “verified emperical data.” If this is indeed the goal of the bills’ sponsors, then they might be interested to see how Darwin’s theory of evolution fairs when subjected to the sort of critical analysis these bills mandate.
So lets do it. Lets put evolution to the test for teachers: “Verified emperical data” or “just a theory”?
If you think about it, Darwin’s assertion that organisms have evolved from a series of simpler ancestors implies that a record of evolutionary change is present in the cells of each of us, in our DNA. According to evolutionary theory, new varieties arise from older ones by changes in genes, and come to predominance through favorable selection. A series of evolutionary changes thus implies a continual accumulation of genetic changes in the DNA. From this you can see that evolutionary theory makes a clear prediction: Two species that are more distantly related (for example, humans and mice) should have accumulated a greater number of evolutionary differences than two species that are more closely related (say, humans and chimpanzees).
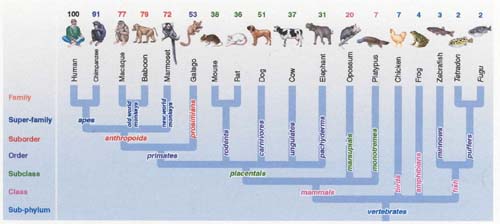
So have they? Lets compare vertebrate species to see. The “family tree” above shows how biologists believe 18 different vertebrate species are related. The wealth of genomes (a “genome” is all the DNA that an organism possesses) that have been sequenced in recent months since completion of the human genome project allows us to directly compare the DNA of these 18 vertebrates.
To reduce the size of the task, investigators at the National Human Genome Research Institute working at the University of California, Santa Cruz, focused on 44 so-called ENCODE regions scattered around the vertebrate genome. These regions, corresponding to 30 Mb (megabase, or thousand bases) or roughly 1 percent of the total human genome, were selected to be representative of the genome as a whole, containing protein-encoding genes as well as “junk” DNA.
For each vertebrate species, the investigators determined the similarity of its DNA to that of humans –that is, the percent of the nucleotides in that organism’s 44 ENCODE regions which match those of the human genome.
You can see the result in each instance presented as a number above the picture of each organism on the vertebrate family tree. As Darwin’s theory predicts, the closer the relatives, the less the genomic difference we see. The chimpanzee genome is more like the human genome (91%) than the monkey genomes are (72-79 %).
In general, as you proceed through the taxonomic categories of the vertebrate family tree from very distant relatives on the right (in the same class) to very close ones on the left (in the same family), you can see clearly that genomic similarity increases as taxonomic distance decreasesjust as Darwin’s theory predicts. The prediction of evolutionary theory is solidly confirmed.
Nor do we have to stop the analysis here. The evolutionary history of the vertebrates is quite well known from fossils, and because many of these fossils have been independently dated using tools such as radioisotope dating, it is possible to recast the analysis in terms of concrete intervals of time, and assess directly whether or not vertebrate genomes accumulate more differences over longer periods of time as Darwin’s theory predicts.
For each of the 17 vertebrates being analyzed, the graph to the right plots genomic similarity — how alike the DNA sequence of the vertebrate’s ENCODE regions are to those of the human genome — against divergence time (that is, how many millions of years have elapsed since that vertebrate and humans shared a common ancestor in the fossil record). Thus the last common ancestor shared by chickens and humans was an early reptile called a dicynodont that lived some 240 million years ago. Similarly, humans and all other land vertebrates are descendants of the recently-discovered Tiktaalik “walking fish,” which shared a common ancestor with other fishes 375 million years ago.
The result seen in the graph is striking and very clear: Over their more than 400 million year history, vertebrates have accumulated more and more genetic change in their DNA. Since humans and chickens diverged 240 million years ago, the genomes of the two species have changed so much that only 7 % of their ENCODE sequences are still the same. Humans and fish diverged even longer ago, and their DNA is even more different, with only 2 % of ENCODE sequences remaining the same. “Descent with modification” was Darwin’s definition of evolution, and that is exactly what we see in the graph. The evolution of the vertebrate genome is not a theory, but an observation.
The wealth of data made available by the human genome project has allowed a clearer look at the evidence for evolution than ever before. The conclusion to which it leads us is that evolution is an observed fact, clearly revealed in the data. Thus under the terms of HB 1266, evolution must be taught to Missouri schoolchildren as “verified emperical data.” Any teacher not doing so would be in clear violation of the statute. I suspect this is not the outcome envisioned when this bill was submitted.
While HB 1266 was reported out of committee with a “do pass” recommendation, it did not come up for a vote before the end of this year’s term. I have little doubt it will appear again next session. Legislators would do well to read it carefully.

© Txtwriter Inc.